Client Account: Financial Overview & Transaction Analysis in Suvit
This guide analyzes your company’s financial data in Suvit, including how to view financial overviews, detailed reports, and transactional analysis.
Before Starting the Analysis, Follow the Steps Below:
- Open the application and click on Sync Voucher.
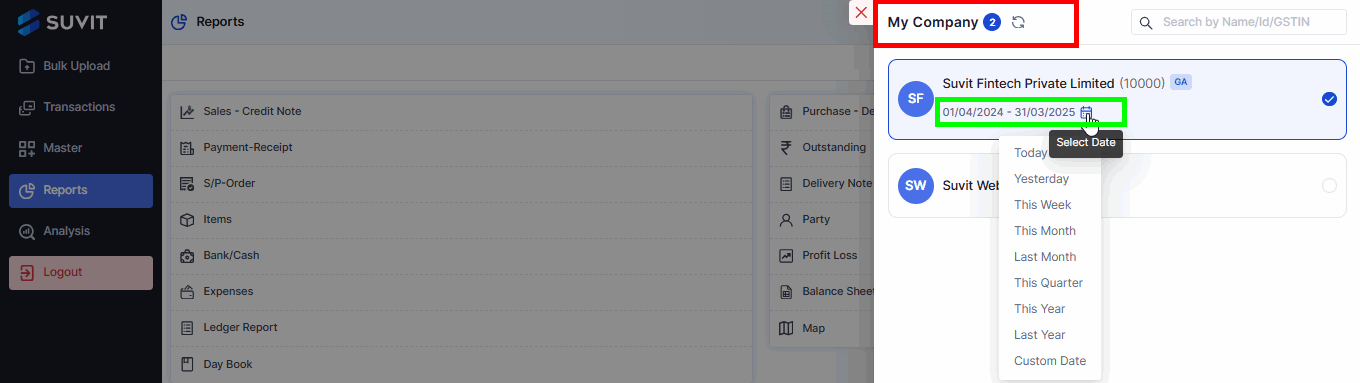
- Choose the company for which you want to analyze the data.
- Select the Financial Year or Custom Date Range.
Note: The sync voucher can only be done from the main account.
Step 1: Navigate to Analysis
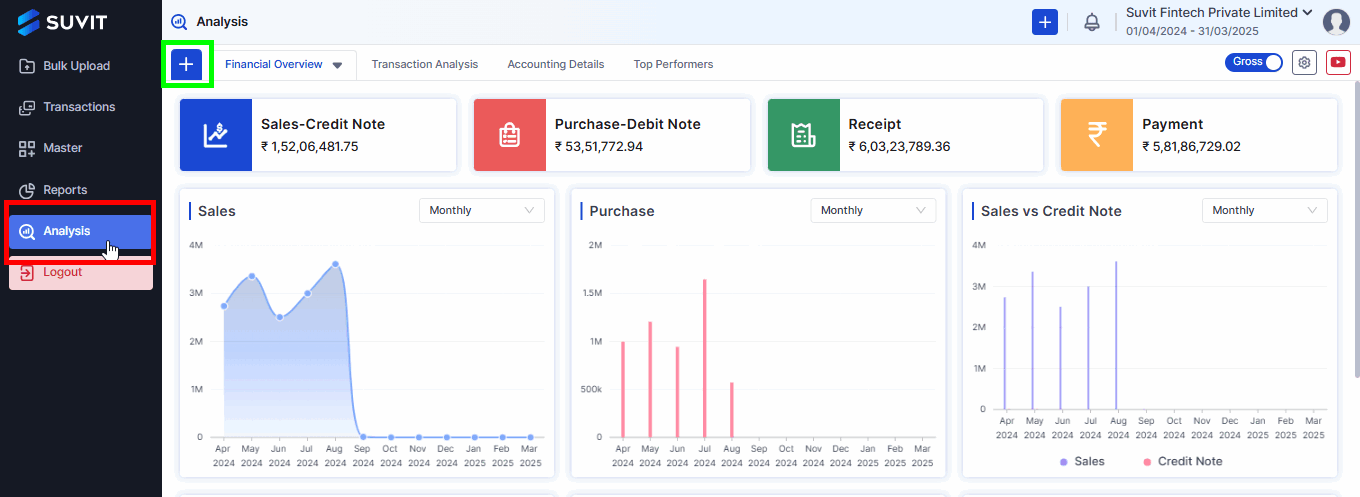
- Go to the left-hand menu and select Analysis.
- Click the "+" (plus) icon to create a customized dashboard based on your specific data requirements.
Step 2: Review Analysis Dashboard
- The dashboard offers a comprehensive overview of the company's financial health, followed by a detailed data breakdown.
**Financial Overview in detail**
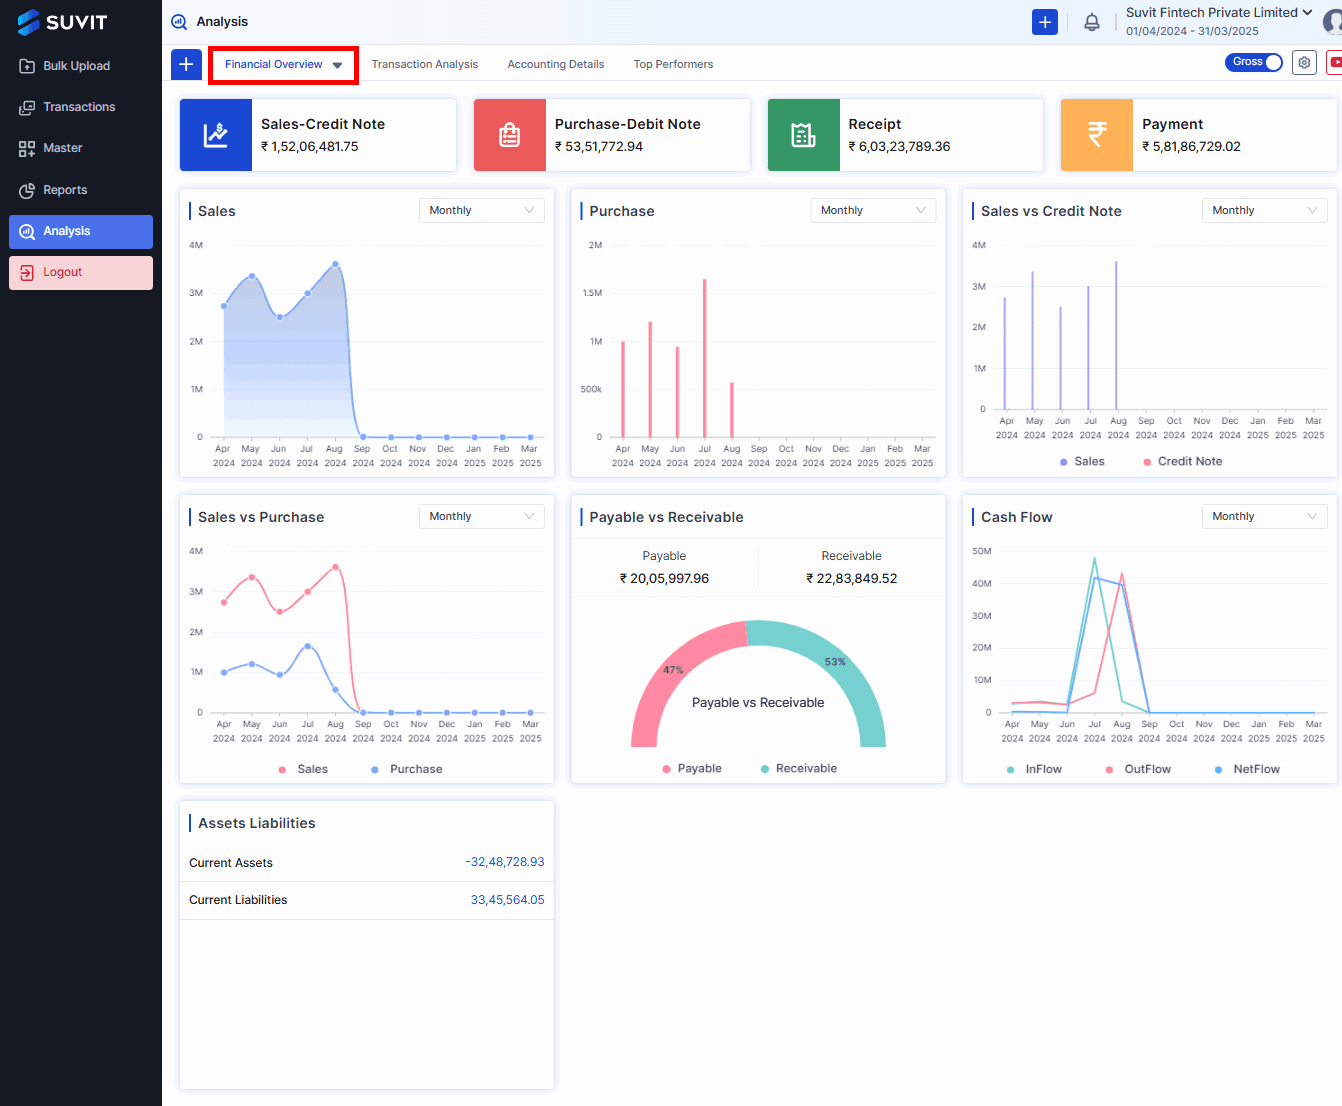
- **Sales (Monthly)**: A line graph showing monthly sales performance.
- **Purchase (Monthly)**: A similar line graph showing monthly purchases.
- **Sales vs. Credit Note (Monthly)**: A graph comparing sales and credit notes issued.
- **Payable vs. Receivable**: A gauge chart showing the proportion of payables and receivables. It indicates **100% payable**, suggesting no receivables are currently recorded.
- **Cash Flow (Monthly)**: A line graph showing monthly cash flow, with inflow, outflow, and net flow indicated.
- **Assets Liabilities**: Shows current assets and current liabilities with specific monetary values.
**Transactional Analysis Overview**
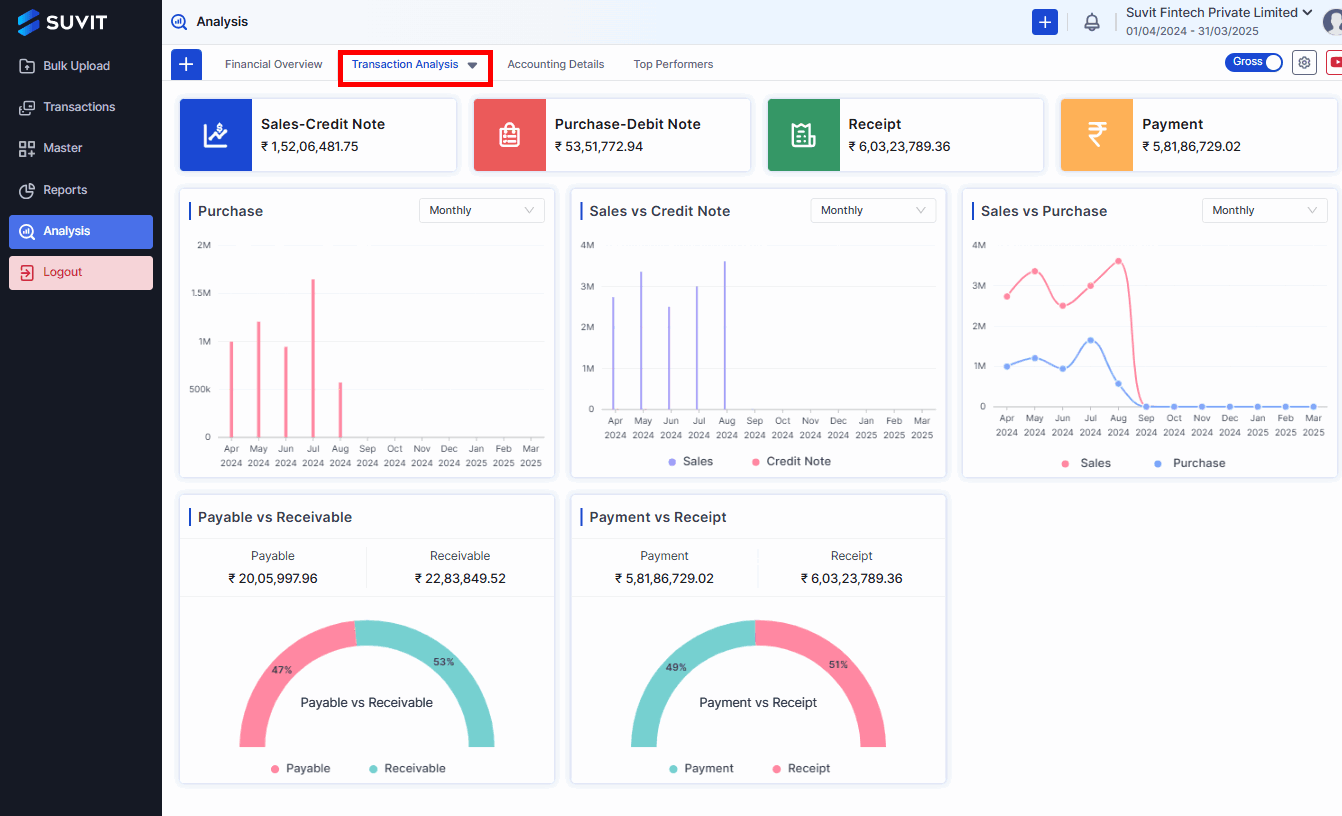
- **Sales-Credit Note**: Shows the total sales minus credit note amounts.
- **Purchase-Debit Note**: Shows the total purchase minus debit note amounts.
- **Receipt**: Shows total receipt amount.
- **Payment**: Shows total payments amount.
- **Sales, Purchase, Sales vs Credit Note, Sales vs Purchase, Payable vs Receivable, Payment vs Receipt**: These are charts showing trends over time. The charts appear empty or incomplete, possibly due to the large date range or lack of data within certain periods.
- **Bank/Cash Balance**: These sections show the total amount in hand, in the bank, and other balances.
- **Ledger group and Voucher group**: It will show you the group details.
- **Top 5 Customers, Top 5 Suppliers**** These tables list the top 5 customers and suppliers based on total transaction amounts.
**Accounting Details**
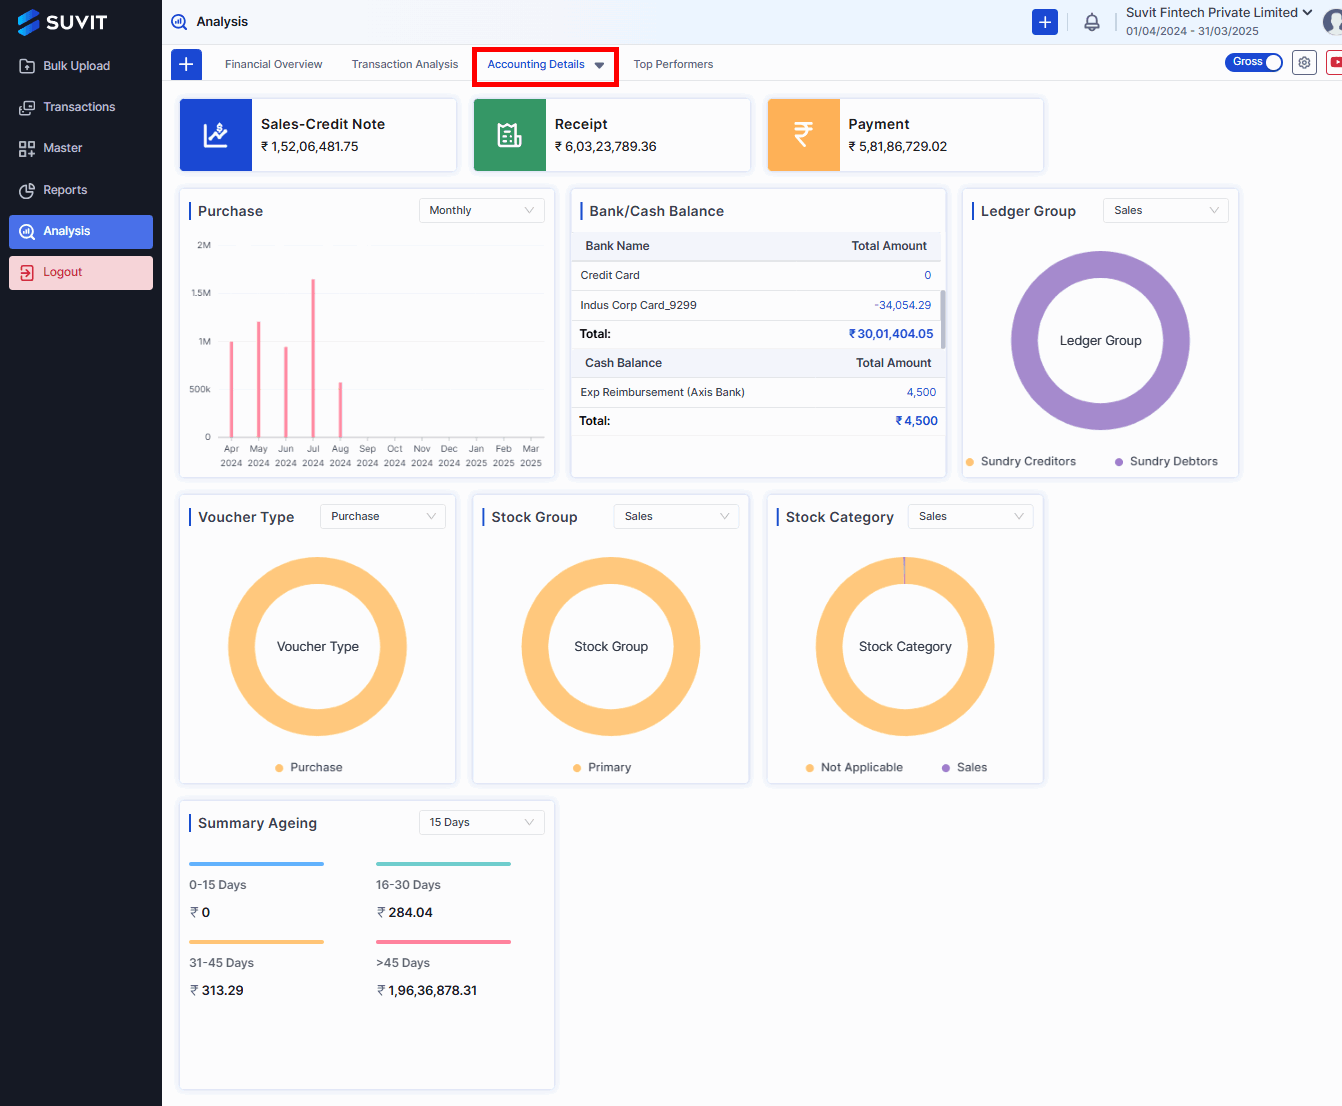
- **Bank/Cash Balance**: Shows balances for different bank accounts and cash on hand. It also provides totals for bank balances and cash balances separately.
- **Ledger Group **:. A donut chart showing the distribution of sales across different ledger groups ("Sundry Creditors" and "Sundry Debtors").
- **Voucher Type**:). A donut chart showing the distribution of sales across different voucher types ("Sales" and "Tax Invoice").
- **Stock Group**: A donut chart showing the distribution of sales across different stock groups ("Primary").
- **Stock Category **: A donut chart showing the distribution of sales across different stock categories.
**Top Performers**
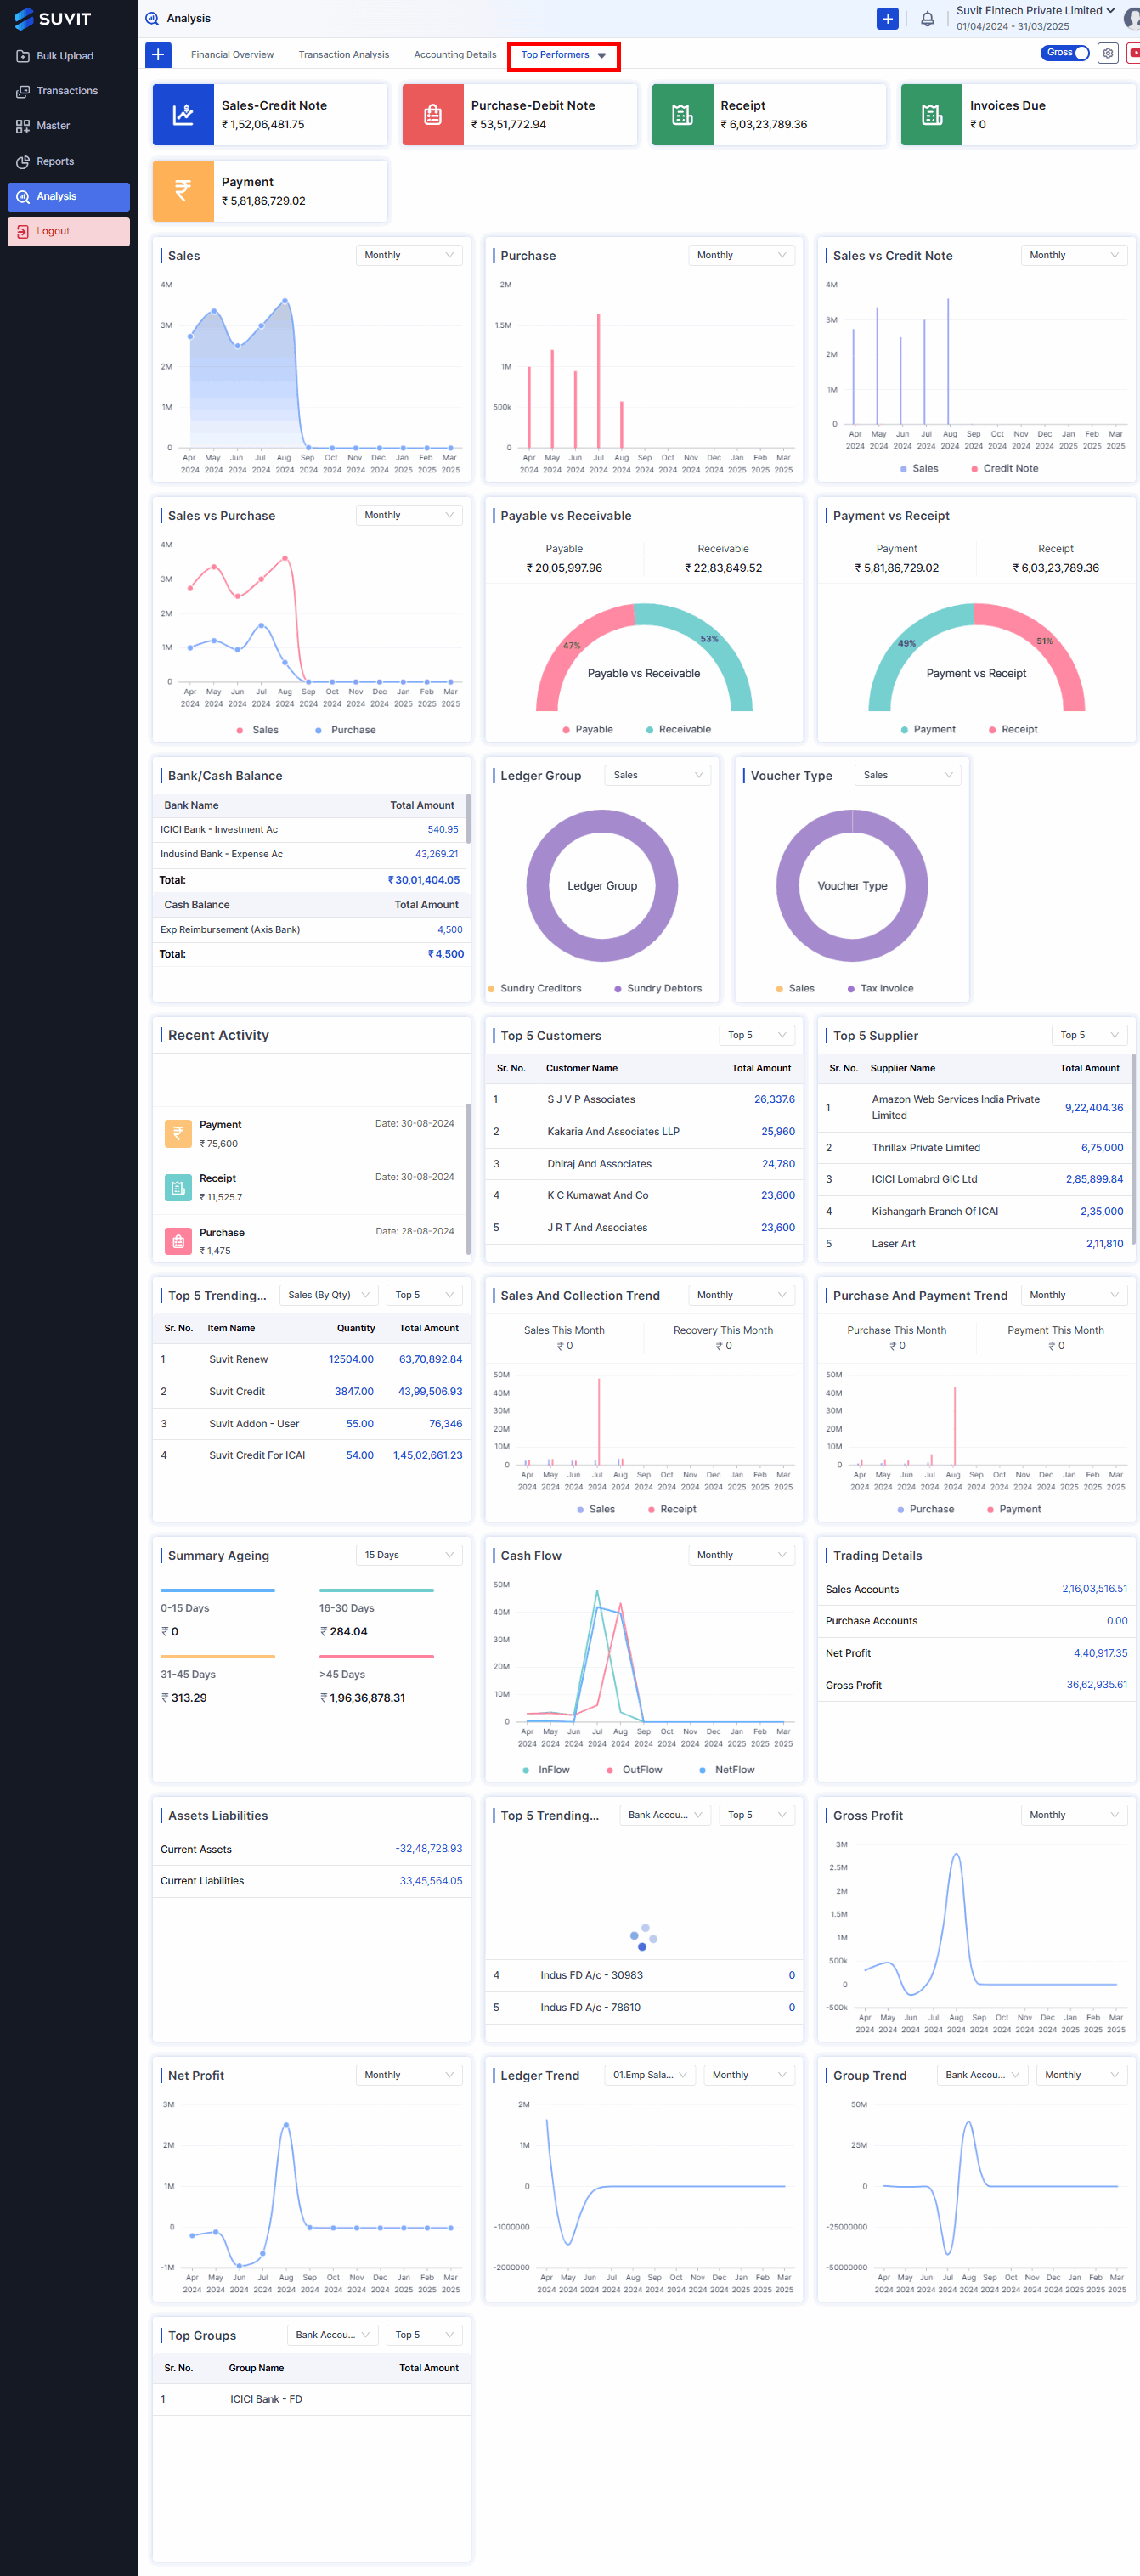
- **Top 5 Customers**: A table listing the top 5 customers by total amount.
- **Top 5 Suppliers**: A table listing the top 5 suppliers by total amount.
- **Top 5 Trending Items (Sales By Qty)**: A table showing the top 5 items sold based on quantity.
- **Top 5 Trending Ledgers**:This would likely list the ledgers with the most activity or significant changes.
- **Gross Profit (Quarterly)**: A line graph showing the gross profit over time.
- **Net Profit (Quarterly)**: A line graph showing net profit over time