Financial Overview and Transaction Analysis in Suvit
Analyze your company’s financial data in Suvit with overviews, reports, and trends. This guide also includes FAQs and troubleshooting for deeper insights.
### Before starting Analysis follow the below steps
-
Open Application and click on Sync Voucher
-
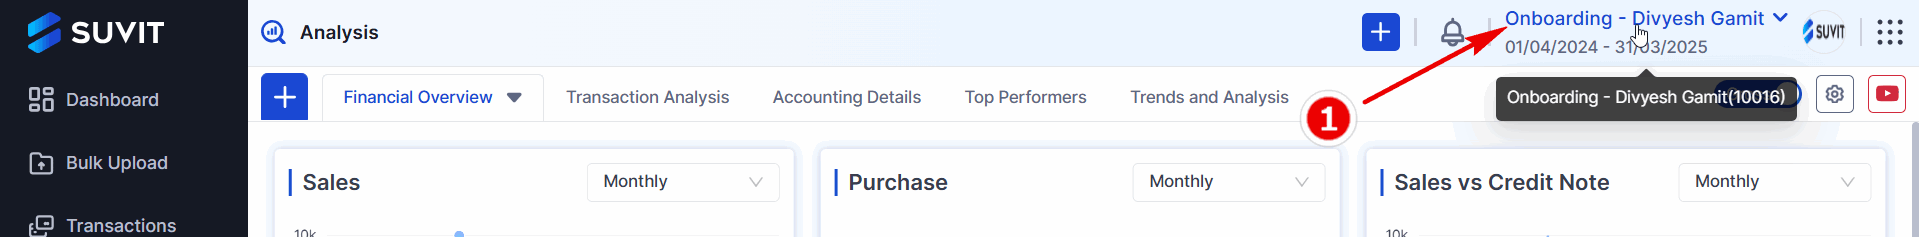
Select your company
-
A left-hand menu provides access to various sections select Analysis
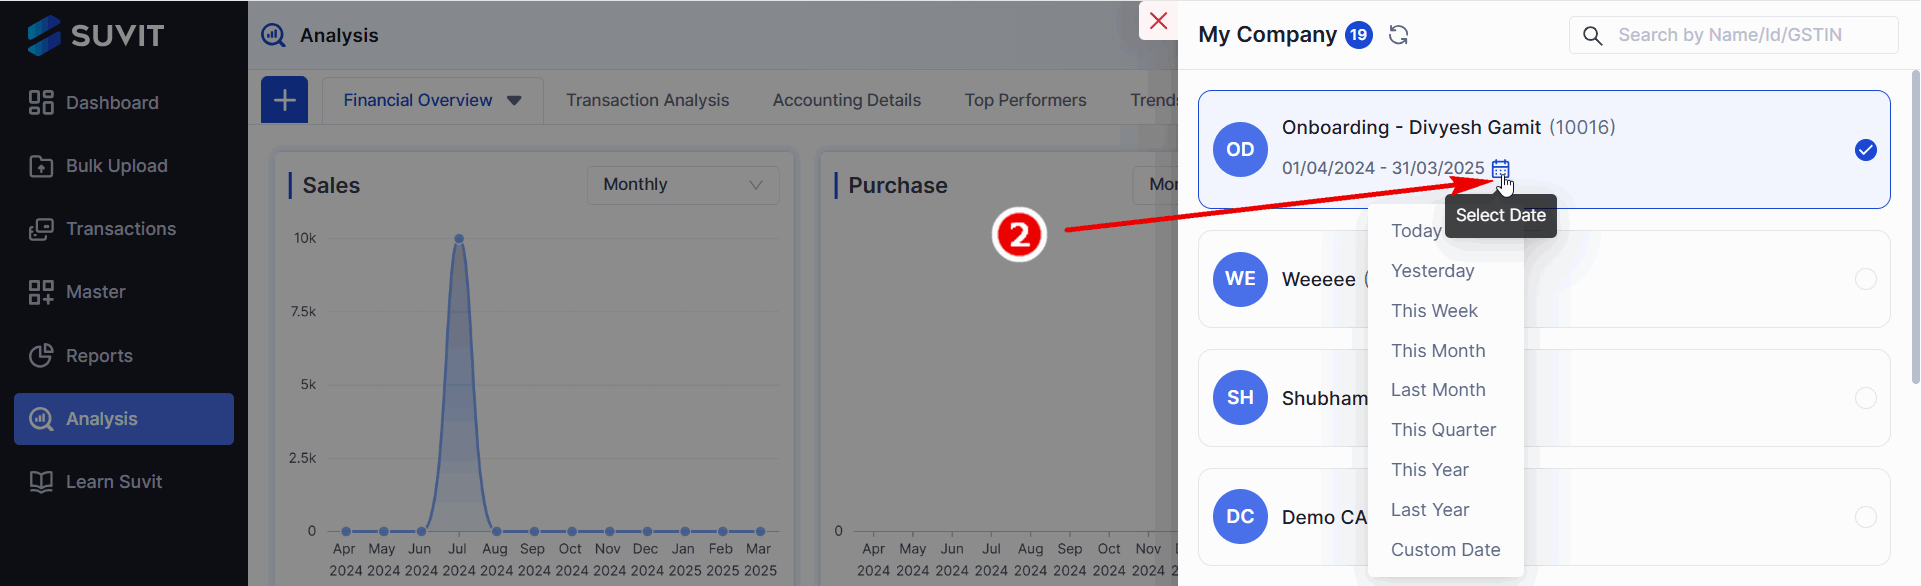
-
Select Financial year or Custom date range
-
The dashboard presents a high-level overview of a company's financial health report.
Below are the data in details
Financial Overview in detail
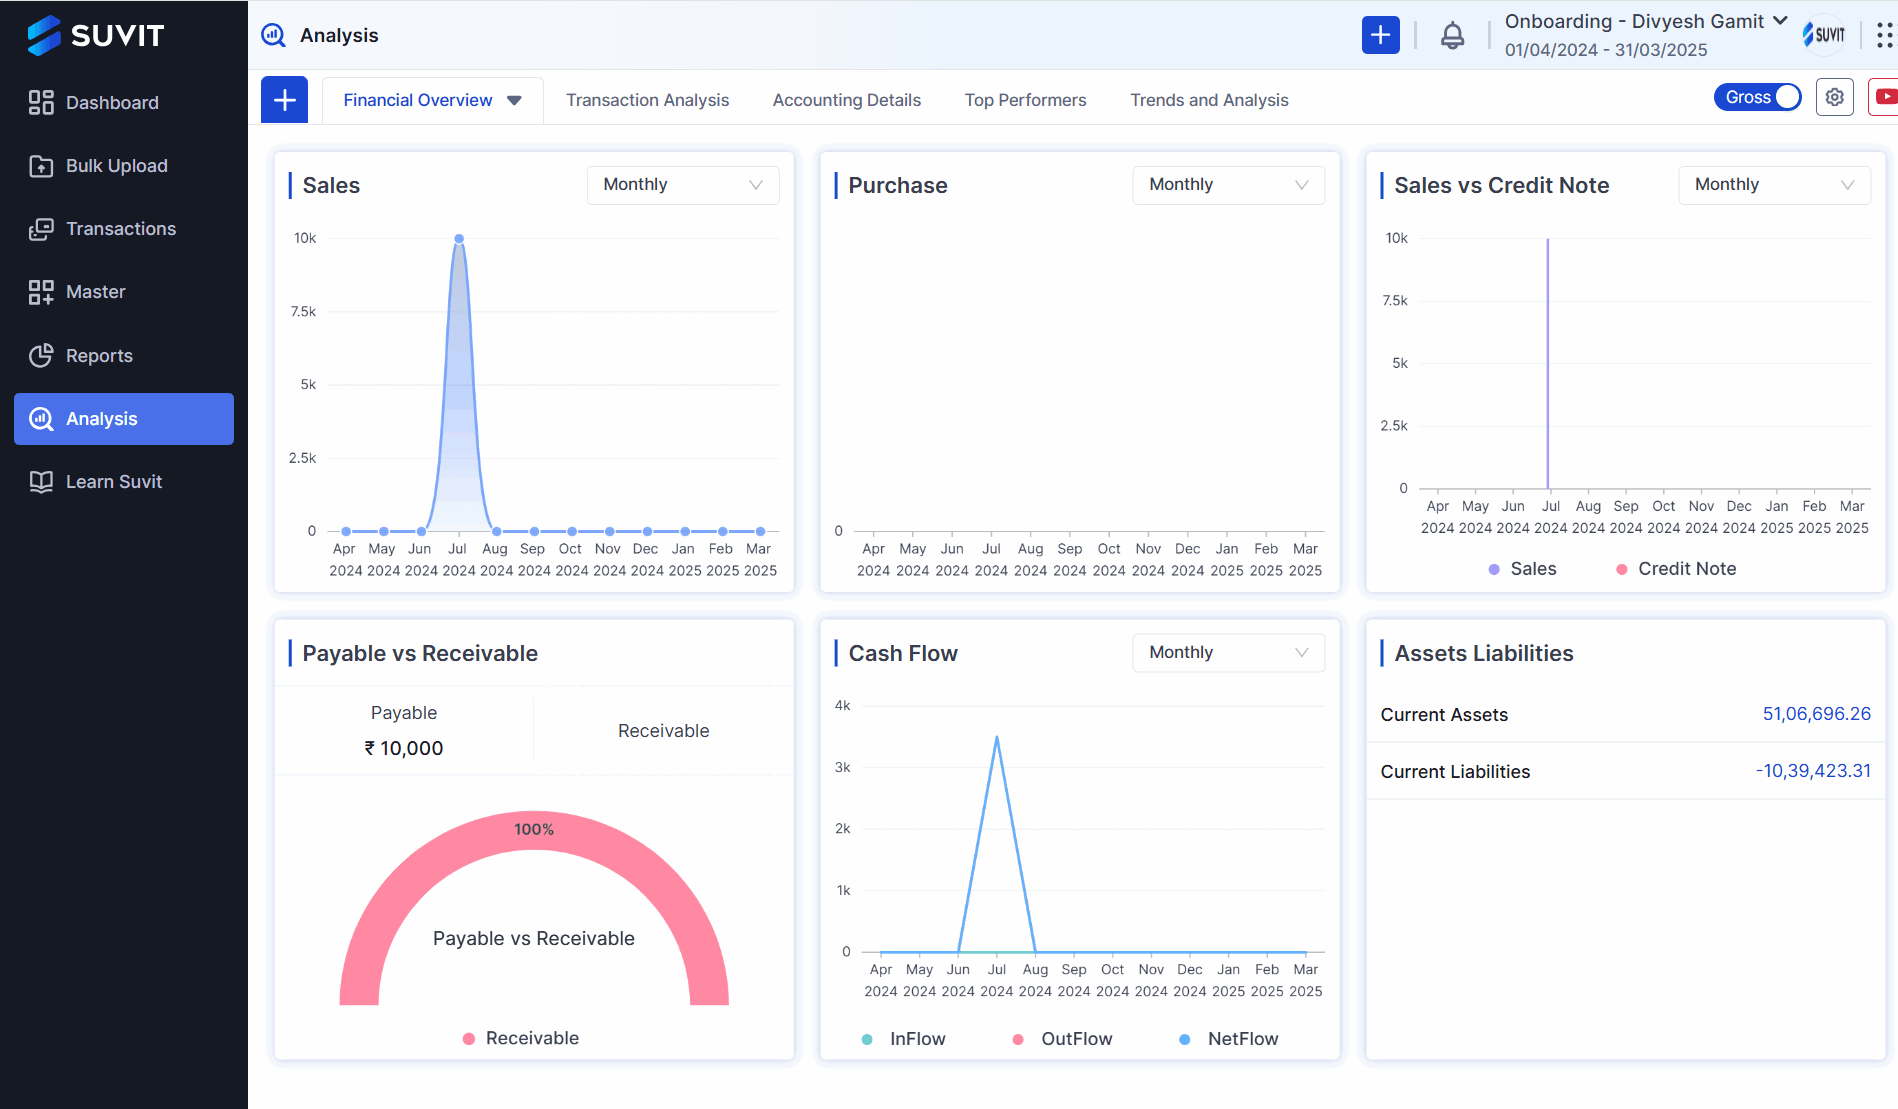
- **Sales (Monthly)**: A line graph showing monthly sales performance.
- **Purchase (Monthly)**: A similar line graph showing monthly purchases.
- **Sales vs. Credit Note (Monthly)**: A graph comparing sales and credit notes issued.
- **Payable vs. Receivable**: A gauge chart showing the proportion of payables and receivables. It indicates **100% payable**, suggesting no receivables are currently recorded.
- **Cash Flow (Monthly)**: A line graph showing monthly cash flow, with inflow, outflow, and net flow indicated.
- **Assets Liabilities**: Shows current assets and current liabilities with specific monetary values.
Transactional Analysis Overview
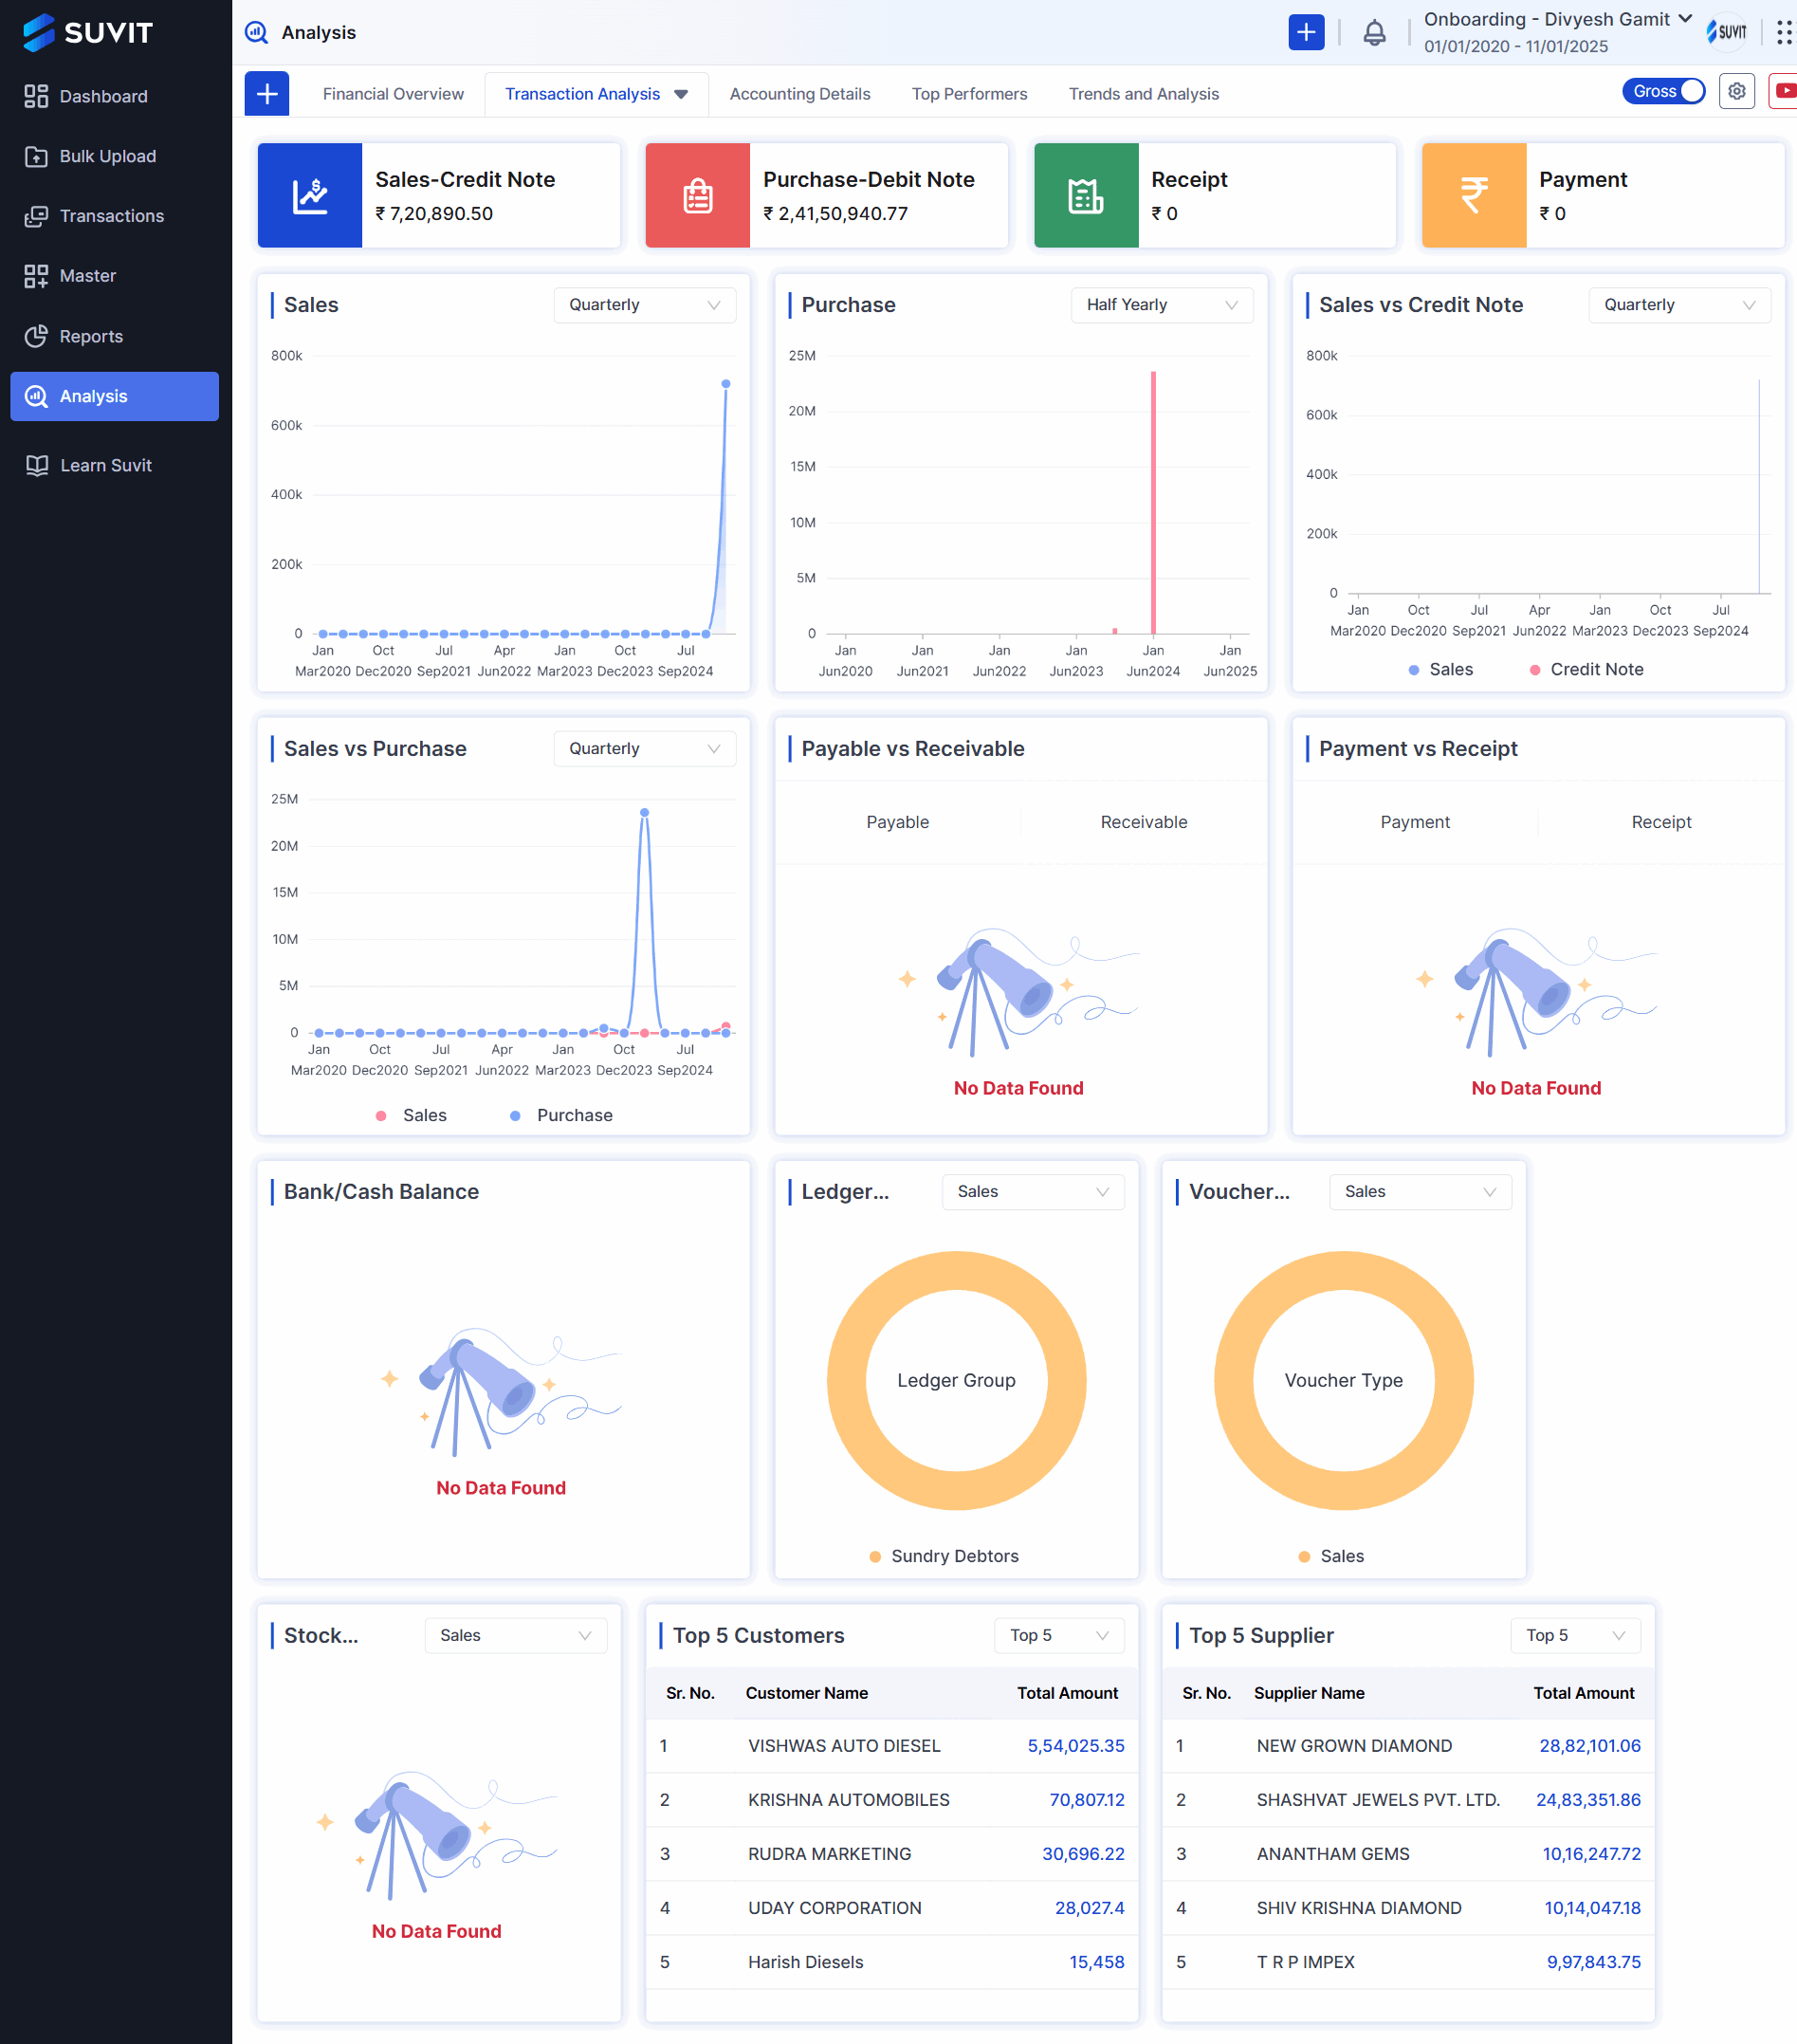
- **Sales-Credit Note**: Shows the total sales minus credit note amounts.
- **Purchase-Debit Note**: Shows the total purchase minus debit note amounts.
- **Receipt**: Shows total receipt amount.
- **Payment**: Shows total payments amount.
- **Sales, Purchase, Sales vs Credit Note, Sales vs Purchase, Payable vs Receivable, Payment vs Receipt**: These are charts showing trends over time. The charts appear empty or incomplete, possibly due to the large date range or lack of data within certain periods.
- **Bank/Cash Balance**: These sections show the total amount in hand, in the bank, and other balances.
- **Ledger group and Voucher group**: It will show you the group details.
- **Top 5 Customers, Top 5 Suppliers**** These tables list the top 5 customers and suppliers based on total transaction amounts.
Accounting Details
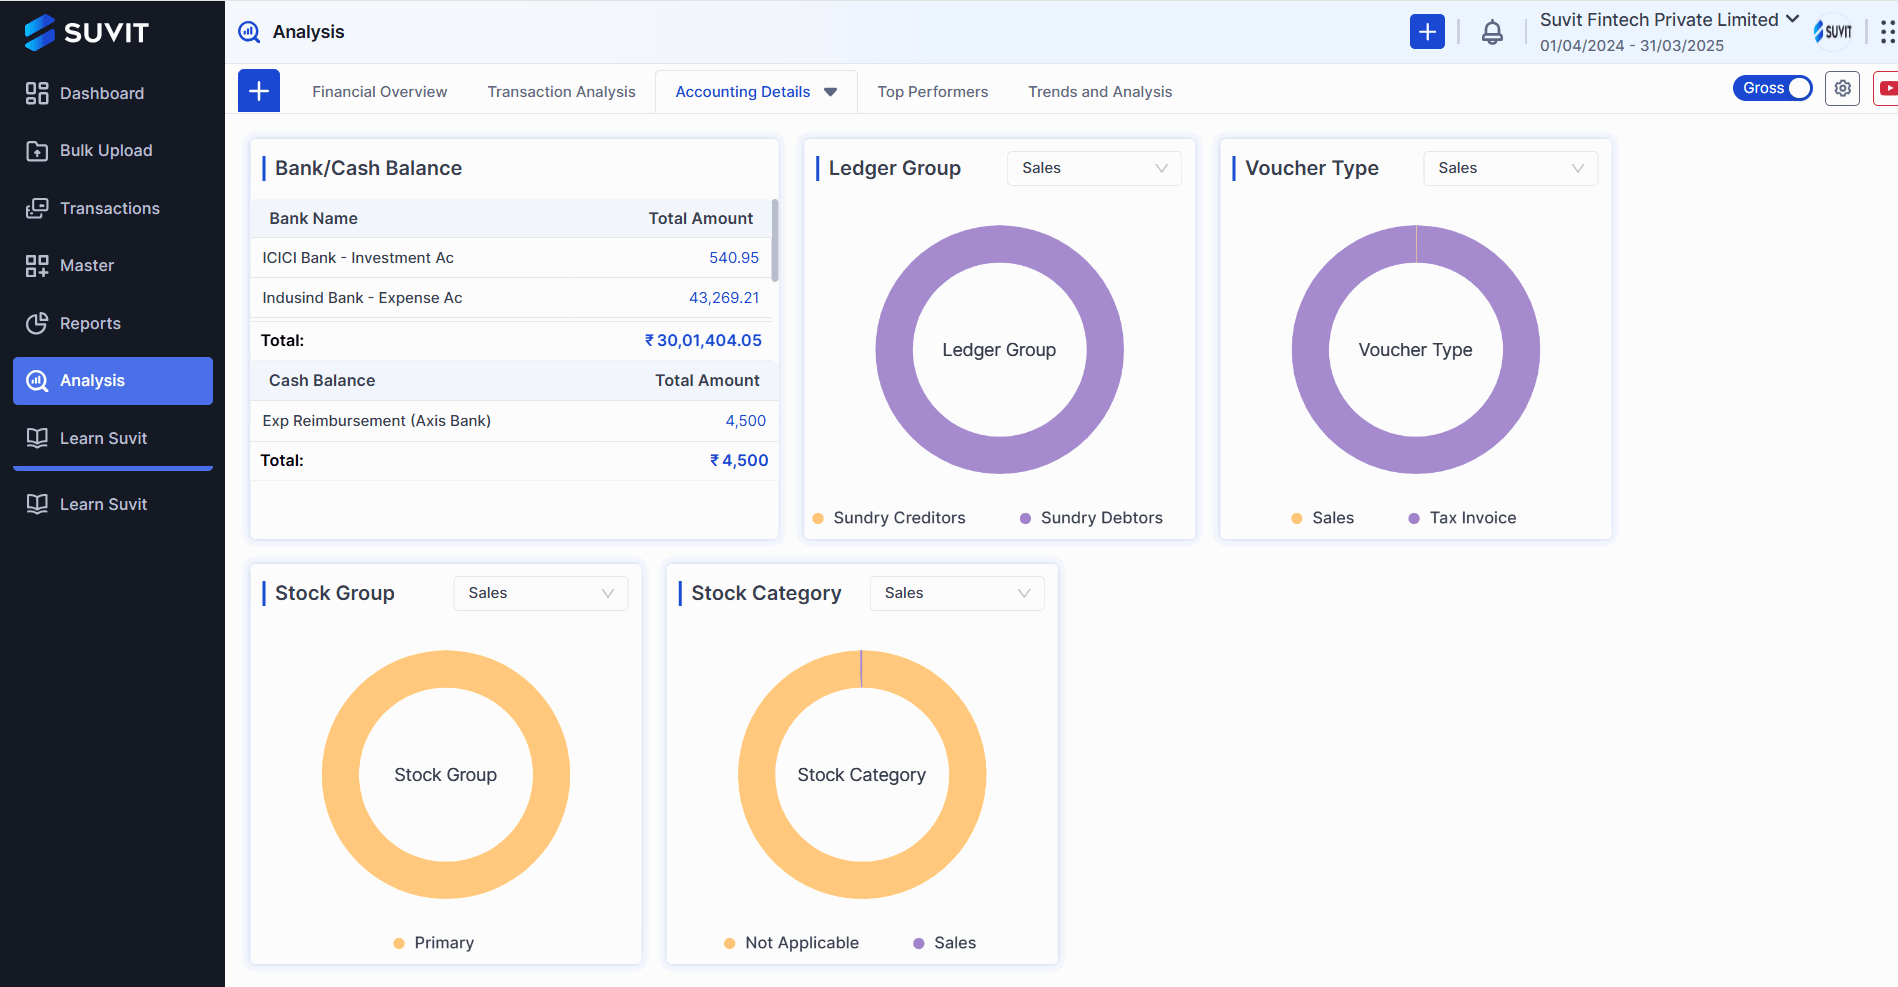
- **Bank/Cash Balance**: Shows balances for different bank accounts and cash on hand. It also provides totals for bank balances and cash balances separately.
- **Ledger Group **:. A donut chart showing the distribution of sales across different ledger groups ("Sundry Creditors" and "Sundry Debtors").
- **Voucher Type**:). A donut chart showing the distribution of sales across different voucher types ("Sales" and "Tax Invoice").
- **Stock Group**: A donut chart showing the distribution of sales across different stock groups ("Primary").
- **Stock Category **: A donut chart showing the distribution of sales across different stock categories.
Top Performers
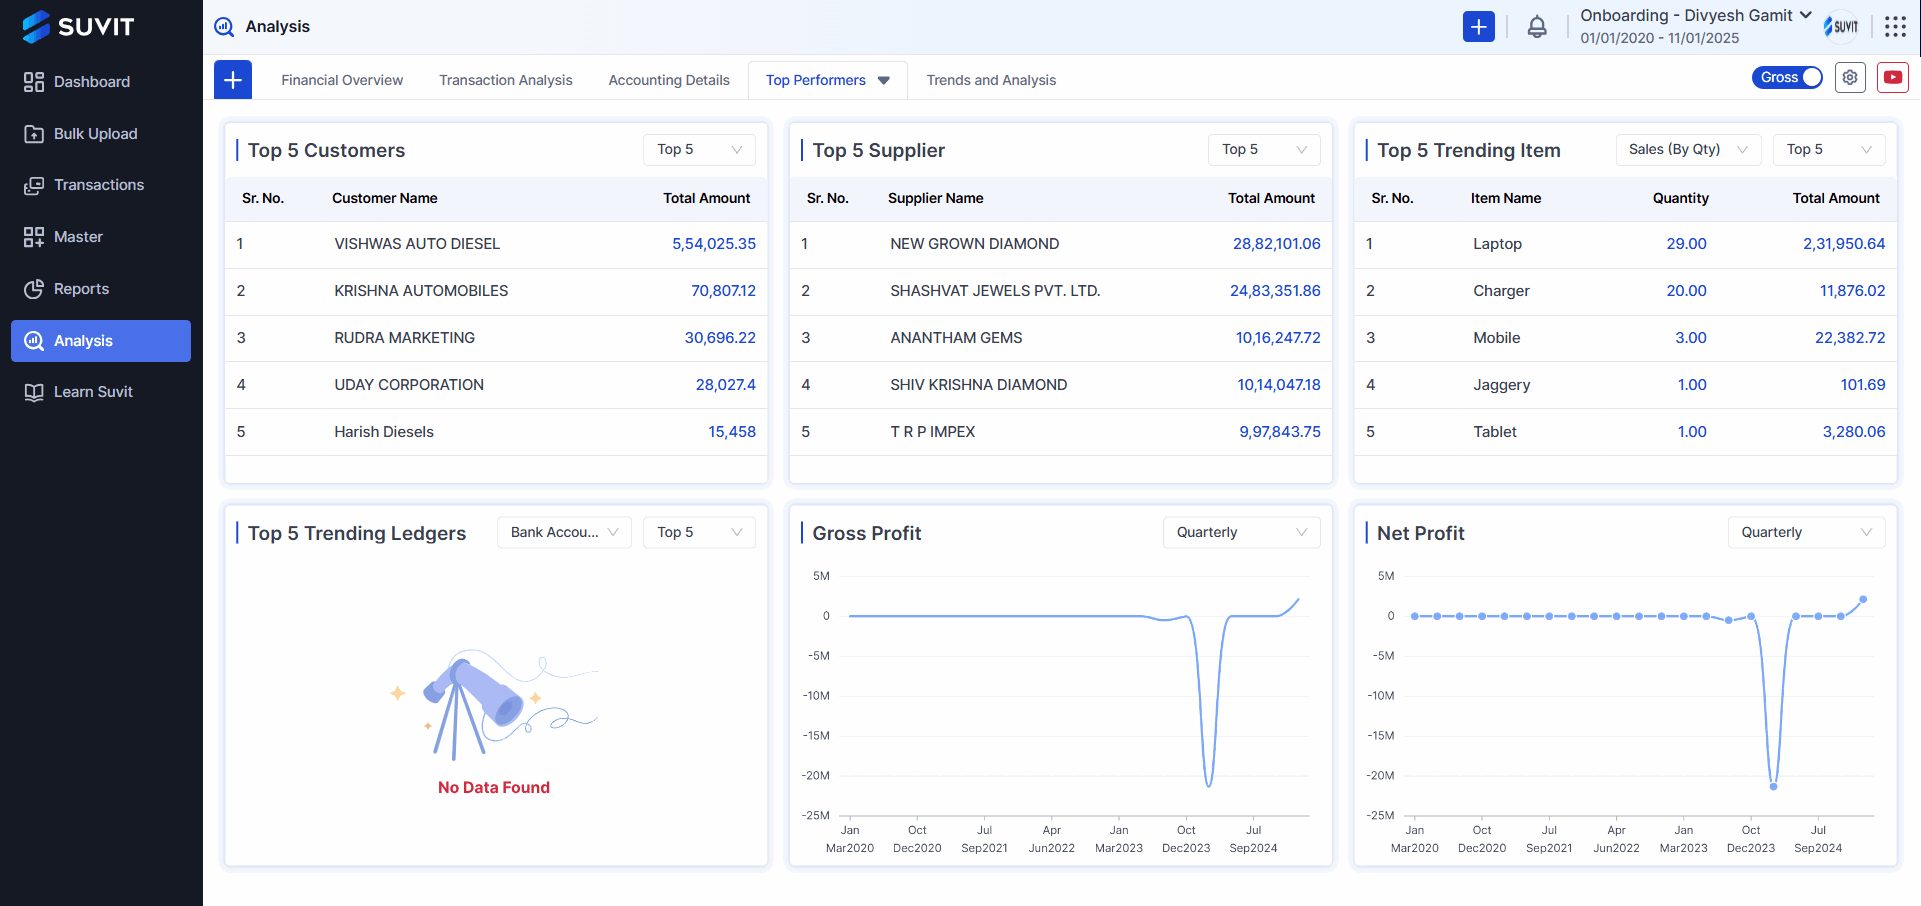
- **Top 5 Customers**: A table listing the top 5 customers by total amount.
- **Top 5 Suppliers**: A table listing the top 5 suppliers by total amount.
- **Top 5 Trending Items (Sales By Qty)**: A table showing the top 5 items sold based on quantity.
- **Top 5 Trending Ledgers**:This would likely list the ledgers with the most activity or significant changes.
- **Gross Profit (Quarterly)**: A line graph showing the gross profit over time.
- **Net Profit (Quarterly)**: A line graph showing net profit over time
Trends and Analysis
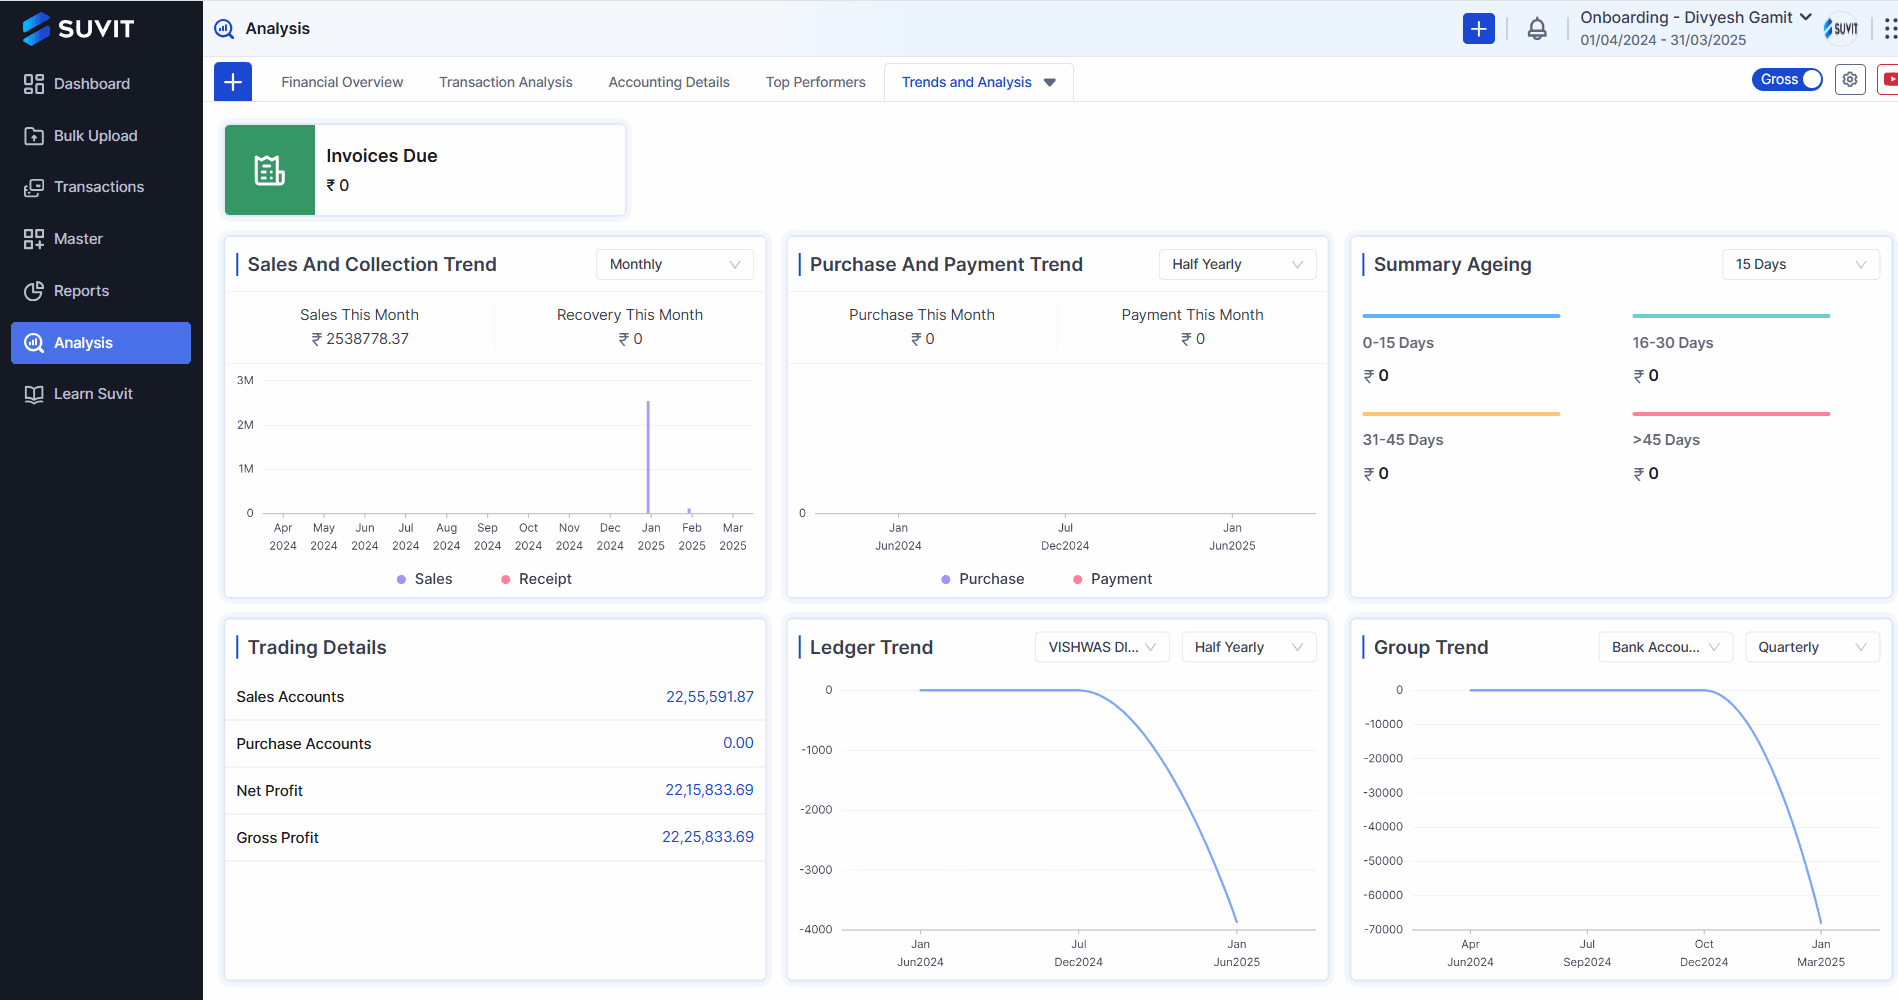
- **Invoices Due**: Shows due invoices
- **Sales And Collection Trend (Monthly)**: A line graph showing sales and receipts (collections).
- **Purchase And Payment Trend**: A line graph showing purchases and payments made
- **Summary Ageing (15 Days)**: A bar chart showing the aging of outstanding invoices, categorized into 0-15 days, 16-30 days, 31-45 days, and >45 days.
- **Trading Details**: It will show you the total trading amount by **Sales Accounts**, **Purchase Accounts**, **Net Profit** and **Gross Profit**
- **Ledger Trend**: A line graph showing the trend of a specific ledger.
- **Group Trend (Bank Account) (Quarterly)**: A line graph showing the trend of a bank account group. you can change view to Monthly and Half Yearly also
### Troubleshooting
The charts are empty. What should I do?
Answer:
MOST IMPORTANT: SYNC VOUCHER from the Suvit Desktop Application and after that REFRESH the page (website)
- Check the date range: Ensure the selected date range includes periods with transaction data.
- Verify data entry: Make sure transactions are correctly entered into the system.
- Check data import: If importing data, confirm the process was successful.
- Contact support: If the issue persists, reach out to Suvit Support for help.
FAQ/Documentation
What is the purpose of the Transaction Analysis dashboard?
Answer: This dashboard provides a detailed view of your company's financial transactions, including sales, purchases, receipts, and payments, over a specified period.
How do I change the date range for the data displayed?
Answer: Click on the date range selector (e.g., "01/01/2020 - 11/01/2025") in the top right to choose a different period. Using a smaller, more relevant date range will likely populate the empty charts with data.
Why are some of the charts and sections showing "No Data Found"?
Answer:
- There may be no transactions of that type recorded within the selected date range.
- Try adjusting the date range to a period with known activity.
- Ensure that data has been correctly imported or entered into the system.
Answer: This tab helps you identify the top performers in key areas of your business, such as customers, suppliers, items sold, and ledgers, as well as providing insights into Gross Profit and Net Profit.
Why does "Top 5 Trending Ledgers" show "No Data Found"?
Answer: This occurs when:
- There isn't enough data to determine trending ledgers within the selected date range.
- No ledger activity has been recorded.
- You may need to contact support for further assistance.
What is the difference between "Sales" and "Sales-Credit Note"?
Answer:
- Sales: Total revenue from sales transactions.
- Sales-Credit Note: Net sales after deducting credit notes issued for returns or discounts.
What is the difference between "Purchase" and "Purchase-Debit Note"?
Answer:
- Purchase: Total cost of purchases.
- Purchase-Debit Note: Net purchases after deducting debit notes for returns or price adjustments.
Answer: These tables list your top 5 customers and suppliers based on transaction amounts during the selected period.
What do the "Bank/Cash Balance," "Ledger...," "Voucher...," and "Stock..." sections show?
Answer:
- Bank/Cash Balance: Balances in bank accounts and cash on hand.
- Ledger...: Breakdown of transactions by ledger accounts.
- Voucher...: Breakdown by voucher type.
- Stock...: Inventory or stock level information.
Answer:
- Top Customers/Suppliers: Identify key business relationships and maintain strong connections.
- Top Trending Items: Adjust inventory and marketing strategies based on popular products.
- Profitability Charts: Analyze gross and net profit trends to improve cost management and revenue generation.
What does "Invoices Due" represent?
Answer: This shows the total amount of overdue invoices.
What do the "Sales and Collection Trend" and "Purchase and Payment Trend" charts show?
Answer: These charts illustrate trends in sales/receipts and purchases/payments over time.
What is "Summary Ageing"?
Answer: This shows the distribution of outstanding invoices based on how long they have been overdue.
What is the difference between "Gross Profit" and "Net Profit"?
Answer:
- Gross Profit: Revenue minus the cost of goods sold (COGS).
- Net Profit: Gross profit minus all other expenses, such as operating expenses and taxes.